
A chart in email, drawn from each reader's own numbers
A chart in email has to be an image, because mail apps do not run chart scripts. A chart layer turns a list of numbers into a column, bar, line, area, pie, doughnut or gauge chart, drawn in your colours and fonts when the email is opened. The numbers can be the same for everyone or come from each reader's record.
How a chart layer works
The common way to put a chart in an email is to export a PNG from a spreadsheet and upload it. That works for one chart sent to everyone. It does not work for a statement where every reader has their own twelve months, and it goes stale the moment the numbers move.
A chart layer keeps the numbers outside the picture. You give it values, separated by commas, and
names for each value. The values can be typed in, or come from a field such as
saved that holds a list like
18,22,31,27. When the email is opened, the image service
reads the values, scales them to the box and draws the chart, with every label set in the template's
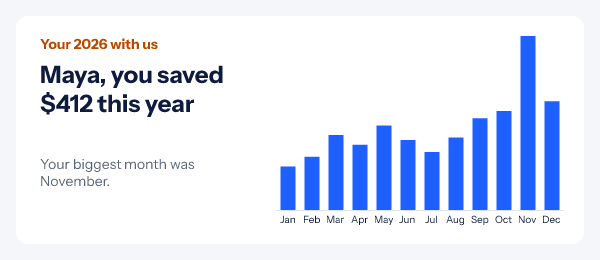
font. The banner at the top of this page is one such render, with Maya's twelve months filled in.
The chart sits in the same image as your headline, so the sentence "you saved $412 this year" and the columns that prove it arrive together, in every inbox, including Outlook on Windows.
What the layer is given
- Kind
- column
- Values
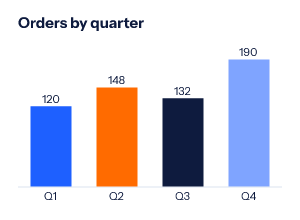
- 120,148,132,190
- Names
- Q1,Q2,Q3,Q4
- Colours
- blue, orange, navy, light blue
What the engine draws
Seven chart kinds for email
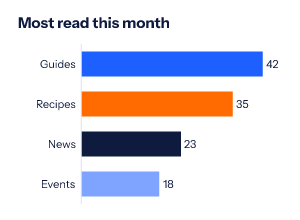
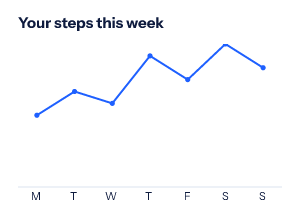
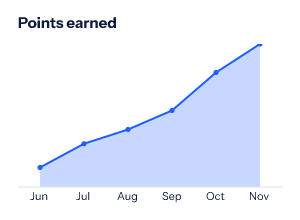
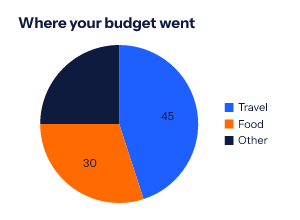
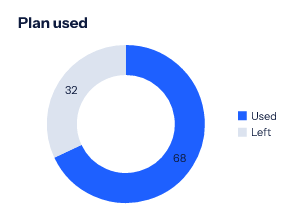
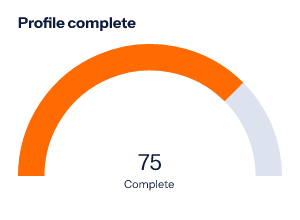
Every card below is a 300 by 220 render from the engine, in brand blue, orange and navy. Values are printed on the bars, points or slices when you turn that on.
-
Column
-
Bar
-
Line
-
Area
-
Pie
-
Doughnut
-
Gauge
How to add a chart to an email
-
Step 1
Add a chart layer
Open a design in the editor and choose Chart from the Add grid. Place it beside the headline that explains it.
-
Step 2
Pick the kind and the colours
Column, bar, line, area, pie, doughnut or gauge. Set the series colours, the text and gridline colours, the label size and font, and an optional top of the scale.
-
Step 3
Give it values and names
Type numbers separated by commas for one chart for everyone, or insert a field so each reader's own list is drawn. Names go in the same way, one per value.
-
Step 4
Publish and paste
Copy the snippet for your platform from the publish dialog. With per-reader values, build the links from a recipient list or the API.
Emails that are better with a chart
Year in review
Orders, savings or distance by month, one chart per customer. See the year in review email guide.
Loyalty and points
A gauge toward the next tier, an area of points earned. The loyalty email guide covers the rest of that email.
Account summaries
Usage against a plan as a doughnut, or a trial's activity as a line, in the trial and renewal emails.
Which plan includes charts
Every plan, Free included, for a chart whose numbers are the same for everyone who gets the link. Different numbers for each reader need a signed image address per recipient, which comes from a recipient list or the API on Growth ($54 a month) and Agency.
Compare the plansWorks with your email platform
A chart is an ordinary image tag. These guides show where it goes in each platform, and how its fields line up with yours.
What a chart in email cannot do
- One series per chart. Colours are used in turn across the values, not as several lines on one axis.
- 24 values at most. Enough for two years by month; a daily year needs to be summarised first.
- No negative axis. A value below zero draws as zero.
- It does not respond to a tap. There are no tooltips; print the values on the chart if the exact number matters.
- Gmail and Apple Mail keep copies. A chart from typed values is the same wherever it is fetched; one built from live data shows the numbers as they were when the copy was made.
Chart in email questions
Can I put a chart in an HTML email with JavaScript?
No. Mail apps do not run JavaScript, so a chart library cannot draw in the inbox. A chart in email has to be an image. A chart layer is drawn by the image service when the email is opened, which means the numbers can change between sends or between readers without you exporting a new picture.
Which chart types are there?
Seven: column, bar, line, area, pie, doughnut and a radial gauge. Each takes up to 24 values and up to 12 colours, used in turn.
Where do the numbers come from?
From the layer’s values: numbers you type, separated by commas, or a field that holds such a list. A gauge reads the first number. The same template can draw the same chart for everyone or a different one per reader.
What happens with a missing or wrong value?
The chart still draws. A value that is not a number counts as zero and prints nothing, so the reader sees a gap rather than a broken image. Negative numbers also draw as zero, because there is no axis below zero yet.
Can the chart use my brand fonts?
Yes, on Starter and above: labels and values can be set in any of the catalogue font families or in a font you upload. Free uses the bundled fonts. Text colour, gridline colour and the series colours are yours to set.
Which plan do I need?
Charts are on every plan, Free included. Different numbers for each reader need a signed image address per recipient, from a recipient list or the API on Growth and Agency.
More you can draw into an email
- Progress Bars Points, goals and steps drawn as a bar.
- Email Polls One-click votes, results in the image.
- Calendars A month with your dates marked.
The merge tag reference shows how a list of numbers reaches the image, and the API reference covers minting a link per reader. Everything else an image can carry is in personalized images for email.
Every feature on one pageShow the numbers, not a sentence about them
Add a chart layer, type the values, paste one image. Free for 5,000 opens a month.